
Introduction
We live in a world overflowing with data, but numbers on a screen don’t speak for themselves. The real magic happens when those numbers are turned into stories that make sense to people and inspire action. That’s the essence of data storytelling—it’s not just about analyzing the data, but about communicating its meaning in a way that drives smart decisions.
Data Storytelling: More Than Just Charts and Graphs
Data storytelling is the practice of translating data analyses into a cohesive narrative that resonates with stakeholders. Unlike data visualization, which focuses on the graphical representation of data, data storytelling weaves numbers, context, and emotion into a story that drives understanding and decision-making.
Imagine presenting a dashboard filled with KPIs to an executive team. Without a narrative, the data may be overlooked or misunderstood. However, when those KPIs are connected to business goals and framed within a storyline—why sales dropped, how customer behavior changed, and what it means for the future—your message becomes clear, memorable, and actionable.
Why Data Storytelling Matters in Business Strategy
Every strategic business decision—from product launches to market expansions—is backed by data. Yet, executives and decision-makers often lack the time or technical background to dig deep into spreadsheets or analytics reports. They need the "so what" behind the data.
Data storytelling makes insights digestible by combining facts with human-centric narratives. It brings clarity to complex datasets and highlights patterns, trends, and opportunities in a way that’s intuitive and persuasive. This empowers leaders to make informed choices faster, reducing risks and maximizing potential.
Take the example of a retail brand analyzing customer purchase data. Rather than just stating, “sales in region A dropped by 15%,” a data story might reveal that a competitor launched an aggressive campaign in the same region, leading to customer churn. This insight turns a statistic into a strategic consideration for future campaigns.
The Core Elements of Effective Data Storytelling
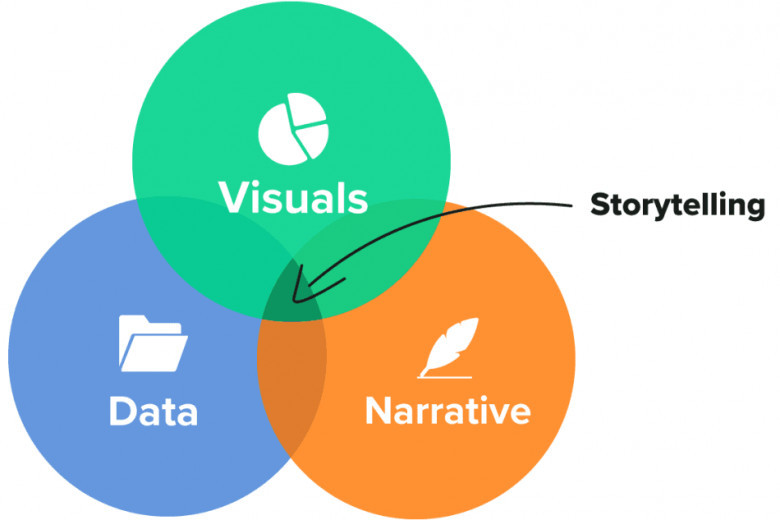
At its heart, successful data storytelling involves three key components: data, narrative, and visuals. Each plays a unique role in shaping the story.
Data: This is the foundation. Clean, relevant, and reliable data ensures that the story is accurate and credible.
Narrative: The storyline connects the dots. It provides context, explains why the data matters, and highlights implications.
Visuals: Charts, graphs, and infographics enhance understanding by illustrating trends and comparisons.
When these elements are balanced well, data stories become powerful tools for change. For example, using time-series data to show a steady rise in user engagement over six months can help justify investment in a new digital marketing initiative.
Real-World Applications: Data Storytelling in Action
Healthcare: Hospitals and public health organizations use data storytelling to track the spread of diseases, improve patient care, and allocate resources. During the COVID-19 pandemic, visual stories highlighting case spikes, recovery rates, and vaccination impacts helped governments and citizens understand the evolving situation.
Finance: Financial analysts use data storytelling to explain market behavior and guide investment decisions. Rather than sharing raw financial data, a well-crafted story can explain how global trends, economic events, or policy changes influence market movements.
Marketing: Marketing teams rely heavily on storytelling to interpret campaign performance. By narrating customer journeys with data—such as how a lead discovered a product and converted—brands gain insights into improving targeting and messaging strategies.
Education: Schools and universities use data storytelling to assess student performance, drop-out rates, and curriculum effectiveness. By visualizing and narrating these metrics, educators can develop targeted interventions to improve learning outcomes.
Tools and Technologies Supporting Data Storytelling
Modern tools have made data storytelling more accessible. Platforms like Tableau, Power BI, Google Data Studio, and Qlik not only offer robust data visualization features but also support the integration of narratives through interactive dashboards.
In addition, artificial intelligence and machine learning are now being integrated into storytelling platforms. These tools can automatically detect patterns and anomalies, allowing analysts to focus on crafting the narrative rather than crunching numbers.
For instance, an AI-driven dashboard might alert a business to a sudden dip in website traffic and suggest potential causes based on historical data. The analyst can then build a story around this insight, including external factors like competitor activity or seasonal trends.
Building a Culture of Data Storytelling in Your Organization
Cultivating a data storytelling culture starts with collaboration. Analysts must work closely with marketing, product, and executive teams to understand their goals and tailor stories accordingly. Training is also essential—data storytellers need to be skilled in both data interpretation and communication.
Encouraging a narrative mindset means going beyond reporting. Teams should aim to answer questions like: What does this data tell us? Why does it matter? What should we do next?
Organizations like Airbnb and Netflix have already embraced data storytelling as a strategic function. Their data science teams routinely present findings in story form, ensuring that insights lead to impactful decisions.
The Future of Strategy Lies in Storytelling
As data continues to grow in volume and complexity, the need for skilled data storytellers will only increase. Businesses that can master this art will gain a significant edge, as they’re able to align data with vision, inspire action, and steer clear of costly misinterpretations. Enrolling in a Data Analytics course in Noida, Gurgaon, Faridabad, Thane, Dehradun and other cities in India can be a strategic step for professionals looking to develop the storytelling skills required to translate data into impactful business strategies.
The most successful strategies are no longer based solely on intuition or gut feeling. They’re powered by numbers, shaped by insight, and brought to life through storytelling. Whether you're an analyst, marketer, or executive, learning how to turn data into compelling narratives is no longer optional—it's essential for strategic success.
Comments
0 comment